

GEO Monitoring Analytics: How to Build an AI Citation Rate Dashboard
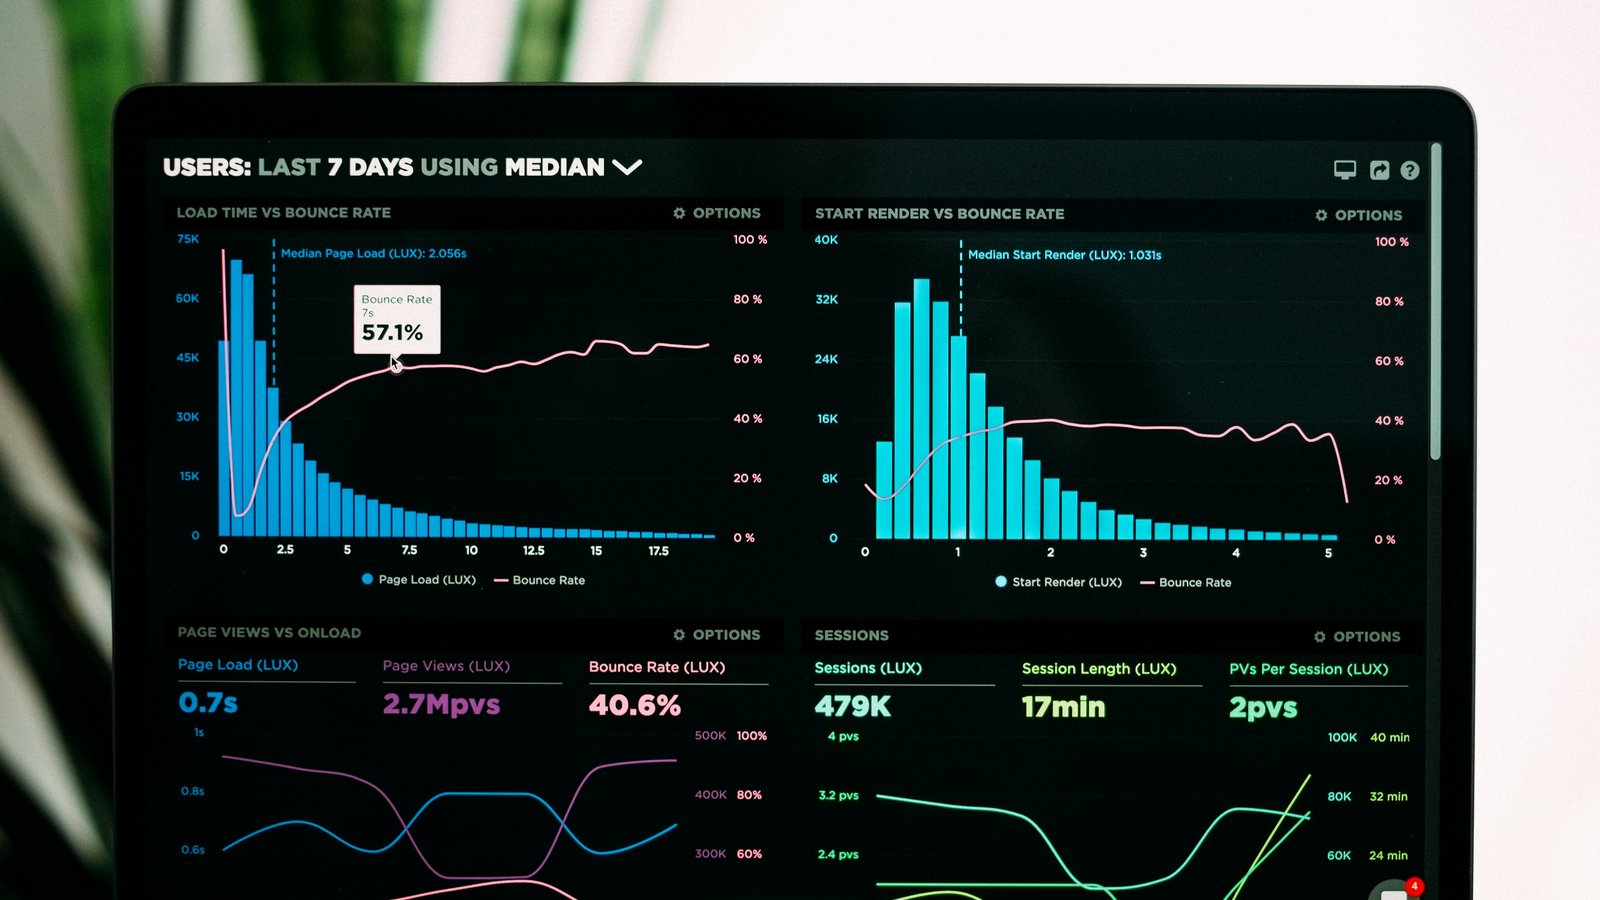
Summary: GEO succeeds or fails not on ranking but on whether AI cites you in its answers. Here is a DIY monitoring method that depends on no heavy tooling: define four core metrics first (mention rate, citation rate, question coverage, accuracy), then sample per engine with a fixed question set, record "mention + cited domain + context" as a trend table, and add an accuracy check to catch wrong citations. Includes Google's Search Console generative reporting, tools such as Profound, Otterly and Topify, and a self-built Python dashboard, across both English and Chinese engines.
Traditional SEO tracks rankings and clicks. GEO tracks something else: when a user asks AI "which vendor should I choose," does the answer carry your brand name and link to your content? Since June 2026 Google has been rolling out a generative AI performance report in Search Console for some sites, showing impressions inside AI Overviews and AI Mode — but that only tells you about impressions. It does not replace real citation attribution. To judge whether AI treats you as a source, you have to build your own monitoring dashboard. This guide breaks that down into steps you can follow.
Key Takeaways
- The primary metric for GEO monitoring is citation rate, not visibility — being indexed and being written into an answer are two different outcomes.
- Four core metrics: AI mention rate (brand appears), AI citation rate (content URL gets cited), question coverage (how broad the covered question set is), and answer accuracy (avoid being cited incorrectly).
- Sampling baseline: a fixed question set (for example 60 procurement decision questions) × 3 engines (ChatGPT/Perplexity/Gemini) × 4 runs each = 720 samples. Because AI answers vary, a single test is not trustworthy.
- Citation sources differ sharply across engines — overlap across the three engines is only about 17%. Watching a single engine creates false reassurance, so sample and report per engine.
- Accuracy matters more than mentions alone: if AI gets your products, certifications, or capacity wrong, that exposure actively damages the brand. Spot-check with a fact-verification table.
- Four steps to a DIY dashboard: build the question set → sample per engine → record the three elements "mention + cited domain + context" → visualize a weekly report. Tools can be layered on top: the GSC report, Profound, Otterly, Topify (10 Chinese and English engines).
- Chinese engines (Wenxin Yiyan, Doubao, Kimi, DeepSeek, Tongyi, Yuanbao) belong in the monitoring scope just like English engines. A Chinese-language market cannot be monitored through ChatGPT alone.
1. Why you have to monitor this yourself
Being seen by AI and making it into an answer are two different things. Content that reaches the retrieval index is not necessarily written into an answer, because relevance ranking and credibility assessment sit in between. More troublesome, the source pools cited by different engines vary enormously. Digital Authority Partners' longitudinal quantification shows that across three sampling waves over 6 weeks, only 10.6% of cited URLs survived all three waves, and the highest overlap between any two engines was just 17%. In other words, performing well in ChatGPT does not mean you perform well in Perplexity or Gemini. Watching one engine alone gives you false reassurance. Monitoring therefore has to be per engine, weekly, and backed by samples.
2. The four core metrics
Do not start by piling on tools. First settle which metrics you will record:
- AI mention rate = answers containing the brand name ÷ total samples. Answers "does the brand show up at all?"
- AI citation rate = answers citing your site or a content URL ÷ total samples. Answers "did the content become an information source?" This is usually far below the mention rate (Sohu example: 15% mention and 7.5% citation across 720 samples).
- Question coverage = target questions where the brand appeared at least once ÷ total questions. Answers "is coverage a handful of questions, or has it become a network?"
- Answer accuracy = share of brand-bearing answers that are factually correct. Wrong citations (mangled products, certifications, or capacity) hurt more than no citation — this is a GEO-specific downside risk.
Supporting metrics: sentiment (positive/neutral/negative) and share of voice (your citations versus competitors' on the target questions). The GEO-RADAR framework merges visibility, exposure position, whether sources are labeled, authority share, referral traffic, action contribution, and cross-platform consistency into a single influence model, which works as a structural reference for the dashboard.
3. The four steps to a DIY dashboard
Step 1: Build a fixed question set
Pick 40–60 real decision questions covering brand names, product names, industry terms, and competitor terms. A question set for an industrial equipment exporter, for example: "How do I choose an industrial pump supplier?" "Which certifications do Chinese industrial pump makers usually hold?" "Which pump type fits high-temperature duty?" Questions should read like what a buyer would actually ask, not like keywords.
Step 2: Sample per engine
Run every question several times against ChatGPT, Perplexity, and Gemini (add Wenxin Yiyan, Doubao, Kimi, DeepSeek, Tongyi, and Yuanbao for the Chinese market). Because answers vary, test each question at least 4 times per engine. 60 questions × 3 engines × 4 runs = 720 samples is a reasonable starting point. Use a neutral procurement prompt, not "what do you think of our brand" — the latter primes the model into saying you.
Step 3: Record three elements
For each sample, record: mention (did the brand appear), cited domain (was it you or a competitor), and context (opening or closing of the answer, whether it carries a link, and whether the description is accurate). Drop these into a trend table and accumulate weekly.
Step 4: Visualize a weekly report
Plot mention rate, citation rate, question coverage, and sentiment as weekly lines, with competitor citations benchmarked on the same chart. Review the data monthly and make a major adjustment each quarter. The dashboard does not need to be heavy — a single spreadsheet with formulas plus a line chart is enough to start.
4. Sampling and frequency
- Frequency: run one round weekly (with the question set fixed) and produce a review monthly. Models update and answers drift, so GEO is a weekly loop, not a one-off.
- Sample size: a small team can start at 30 questions × 3 engines × 3 runs = 270; once the question set stabilizes, expand to 60×3×4.
- De-randomize: a single test is meaningless — take the ratio across multiple runs.
- One column per engine: give every engine its own column instead of merging them into one total. With overlap at only 17%, a merged figure hides a collapse on any single engine.
5. Accuracy verification (guarding against wrong citations)
Being cited incorrectly is worse than not being cited. Build a fact-verification table: every time you spot-check brand-bearing answers, verify 5 company facts item by item — main products, primary application industries, certification information, OEM/ODM capability, and target markets. For example 20 brand-bearing answers × 5 facts = 100 verification items, from which you compute an error rate. When the error rate rises, fix the wording and structured data of the passage the AI misread before adding more content.
6. Tools and self-built scripts
- Google Search Console generative AI performance report (rolling out since 2026-06): shows AI Overviews and AI Mode impressions, broken down by page, country, date, and device. Good for impressions; it does not replace citation attribution.
- GEO-focused monitoring SaaS: Profound, Otterly.AI, Semrush AI Toolkit, Geoptie, HubSpot AI Search Grader — fine-grained metrics, strong on English engines, most with citation-drift alerts.
- Chinese and English in one place: Topify.ai monitors ChatGPT, Gemini, Perplexity, Claude plus Doubao, Kimi, Wenxin Yiyan, Tongyi Qianbao, DeepSeek, and Tencent Yuanbao — 10 engines in total, with traceable sources, a visual backend, and weekly reports. For Chinese-language markets, prioritize coverage.
- Self-built dashboard: a Python script plus LLM APIs that asks on a schedule, compares the output, and writes "did it cite you / where did it cite / did it include a link" into a database, visualized with Grafana or a spreadsheet. Lightweight, controllable, no subscription cost — a good fit for engineering teams.
- Manual fallback: use Perplexity Pro and You.com to check whether you are cited; run Originality.ai or CopyLeaks to detect content rewriting; and use GA4 with UTM parameters to track the indirect traffic from "AI follow-up searches."
7. Common mistakes
- Watching rankings only: GEO tracks citation rate, not rank. Traditional SERP position 1 ≠ AI citation.
- Watching one engine only: overlap across the three engines is only 17%, so hitting the target on one engine masks a collapse on the others.
- Drawing conclusions from a single test: AI answers vary, so you need ratios from repeated sampling.
- Self-testing with "what do you think of our brand": that primes the model; use neutral procurement prompts.
- Weighting mentions over accuracy: wrong citations damage the brand, so accuracy must be verified as its own column.
- Monitoring English engines only: Chinese-market users run Wenxin Yiyan, Doubao, and Kimi; skipping Chinese engines leaves you half blind.
FAQ
Q: What is the single most core metric in GEO monitoring?
A: The AI citation rate — the share of answers that carry your content URL. It is closer to the essence of "becoming an information source" than the mention rate. But read it together with question coverage (how broad the coverage is) and accuracy (avoiding wrong citations); any one metric on its own leads to misjudgment.
Q: Can a small team without budget for GEO SaaS monitor this itself?
A: Yes. A fixed set of 30–60 questions, weekly per-engine sampling of 3–4 runs, and a trend table recording mention, cited domain, and context will get you running. Engineering teams can build their own dashboard with Python plus an LLM API. The GSC generative AI report shows impressions for free; paid tools like Profound and Otterly accelerate the work but are not required.
Q: Why does every question need to be tested multiple times?
A: Generative AI answers are non-deterministic, so a single test may happen to cite you and another may not — there is no statistical meaning. Only the ratio from multiple engines × multiple runs is stable. The industry baseline is 60 questions × 3 engines × 4 runs = 720 samples.
Q: Do Chinese AI engines need monitoring too?
A: Yes. When you serve Chinese-language markets, Wenxin Yiyan, Doubao, Kimi, DeepSeek, Tongyi Qianwen, and Tencent Yuanbao are genuine entry points. Tools like Topify.ai cover 10 Chinese and English engines at once; a self-built script just needs to add the Chinese engine APIs into the same question set. Watching only ChatGPT leaves half the market unmeasured.
Q: What do I do when AI cites me incorrectly?
A: First build a fact-verification table to locate the wrong sentence, then fix the wording and structured data for that passage (Organization sameAs, Article, FAQPage) so AI picks up accurate facts. Re-test with a neutral procurement prompt to confirm the error rate drops. A wrong citation is a negative signal and takes priority over adding new content.
About Tengence
Tengence GEO provides per-engine AI citation rate monitoring with weekly dashboards covering ChatGPT, Perplexity, Gemini, Claude, and Chinese engines such as Wenxin Yiyan, Doubao, and Kimi, bringing mention rate, citation rate, question coverage, and accuracy verification into a single panel and closing the loop from monitoring to correction. TENGENCE is the enterprise growth engine for the AI era, focused on public-traffic acquisition and private-domain conversion; its core products are Tengence GEO (a dual-engine GEO + SEO strategy) and Tengence Search.
Related Reading
- Do You Still Need Backlinks in the AI Era? What 75,000 Brands' Citation Data Shows
- Is Structured Data Still Worth It After Google Retired FAQ Rich Results?
- What Is GEO (Generative Engine Optimization)? Definition, How It Works, and How It Differs from SEO
Data Sources
- Google Search Console: generative AI performance report (rolling out since 2026-06): covers AI Overviews and AI Mode with impressions broken down by page, country, date, and device; shows impressions, does not replace citation attribution.
- Sohu: which metrics actually matter when a foreign-trade B2B company does GEO: a fixed test question set plus 60 questions × 3 engines × 4 runs = 720 samples; formulas for mention rate, citation rate, and question coverage, plus the fact-verification table.
- Digital Authority Partners: The AI Visibility Gap Study: across 3 waves over 6 weeks only 10.6% of cited URLs survived, and the highest overlap between any two engines was 17% (the basis for per-engine monitoring).
- ifeng Hebei: how AI brand monitoring SaaS tools stack up: a four-dimension ranking (engine coverage, traceability, actionability, cost) across three tool types; Topify.ai covering 10 Chinese and English engines.
- GEO-RADAR / BAI evaluation frameworks (industry survey): five dimensions — visibility, accuracy, influence, traffic, authority — plus a composite model of citation frequency × quality × conversion (a structural reference; the link points to a related article on this site).

