

Funnel Analysis Methodology: How to Precisely Locate Drop-off Points
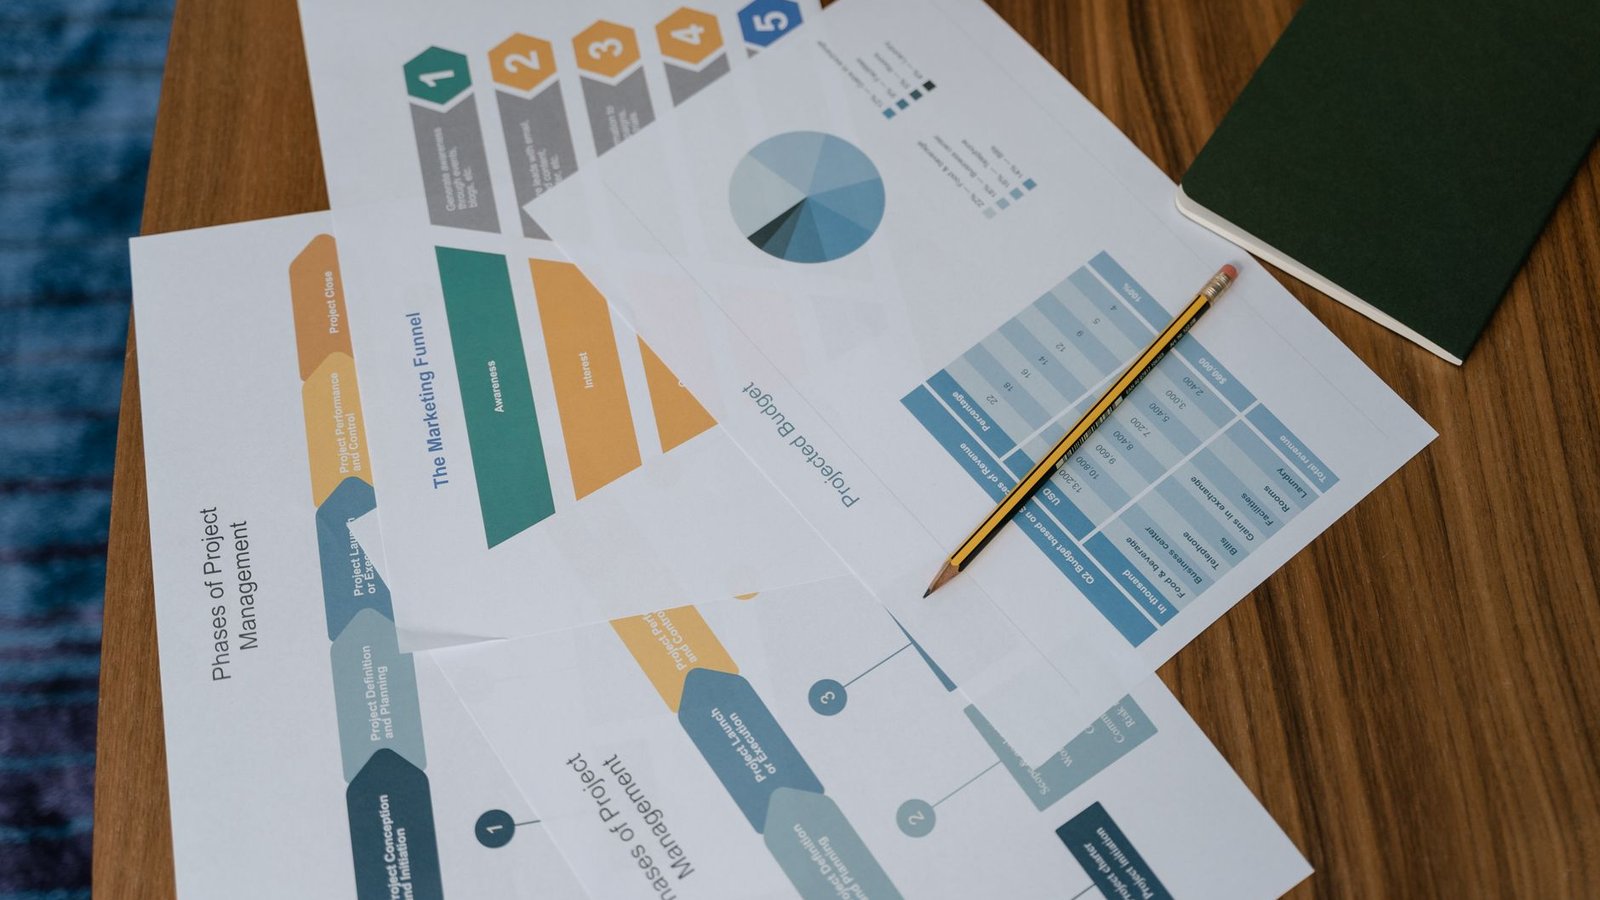
Summary: The output of funnel analysis is not a funnel chart but a conclusion: where drop-off occurs, which segment of users, and why. Before building a funnel, make three decisions: how to segment steps, how long the window, and what to count; to locate drop-off, drill down in three layers: compare segment gaps, break down by dimensions, and cross-reference behavioral data. Skipping the decisions and jumping straight to drawing only visualizes the chaos.
Funnel analysis is one of the most commonly used tools in data analysis, and also one of the easiest to make hollow: a team draws a five-layer funnel from visitor to purchase, pairs it with a pretty trapezoid chart in the report, then what? If the only conclusion is "62% drop off at payment" — everyone already knows that number, and the analysis adds no information. The real value of funnel analysis lies in localization: narrowing "a lot of drop-off" down to "which step, which people, at which action", so that later optimization has a clear target. This article gives a practical funnel analysis method: first the three decisions that must be made right before building a funnel, then the layer-by-layer drill-down path to locate drop-off, and finally a summary of the three most common pitfalls.
Key Takeaways
- The first principle of a funnel is "the ordered key steps in the user journey"; the standard for segmenting steps is that each segment maps to one actionable intervention.
- Window definition directly changes the conclusion: attributing add-to-cart to payment by same-day versus seven-day can make the drop-off rate differ by more than ten points.
- The counting unit must stay consistent throughout: by session, by user, or by event; mixing them makes the segment numbers impossible to multiply.
- Locate drop-off with a three-layer drill-down: first compare segment gaps against your own baseline, then break down by channel, segment, and device, and finally cross-reference behavioral data for the specific action.
- Each segment's drop-off must distinguish "normal water level" from "abnormal gap": compare against your own historical fluctuation range, not against an ideal value.
- The endpoint of funnel analysis is an actionable step: specify which page to change, the expected lift, and when to re-verify; otherwise the analysis is incomplete.
1. What Problem Does Funnel Analysis Solve
The essence of a funnel is decomposing a complex result (purchase) into ordered key steps, turning "a bad result" into "one specific step is bad". Its value depends on two premises:
Steps are intervenable. Each funnel segment should map to an action that product, operations, or acquisition can change: product-page reach rate maps to traffic intake quality, add-to-cart rate maps to product-page quality, and checkout-initiation rate maps to cart design. If no one can intervene on the segments you cut, the funnel is just report decoration.
Numbers are comparable. Funnel segments must multiply and reconcile: reach rate x add-to-cart rate x checkout rate x payment rate should approximately equal the total conversion rate. A funnel that does not reconcile indicates chaotic definitions, and the localization conclusion is unreliable.
So when doing funnel analysis, eighty percent of the effort goes before drawing: how to segment, how long the window, what to count; these three decisions determine the credibility of the analysis.
2. Three Decisions Before Building a Funnel
Decision one: step segmentation. Too coarse (visit to purchase in 2 segments) cannot locate the position; too fine (every button click as a segment) lets noise drown the signal. Rule of thumb: e-commerce 4–6 segments, each with a clear user action and page carrier. A common cut is "product-page arrival -> product detail -> add to cart -> checkout initiation -> payment success". B2B lead-gen scenarios: "visit -> lead capture -> qualified lead -> opportunity".
Decision two: window period. The attribution window between adjacent steps determines drop-off recognition: a user adds to cart today and pays 3 days later: does that count as funnel drop-off? By "same day", the drop-off rate is overestimated; by "seven days", the funnel is closer to reality but responds slowly. The choice depends on business rhythm and decision needs; the key is consistency throughout and noted on the dashboard. Low-ASP fast-moving consumer goods can use same-day attribution; high-ASP durable goods seven days or even thirty days.
Decision three: counting unit. Counting by session, by user, or by event yields completely different funnel shapes. By session is most common (experience analysis); by user suits answering "how many people eventually purchased"; by event is only for deep digging in specific segments. Mixing is the number-one cause of funnels that fail to reconcile.
3. Five-Segment Standard Funnel and Baseline Comparison
Using e-commerce as an example, each of the five funnel segments has a corresponding business meaning and common baseline:
| Segment | Conversion | Meaning | First suspect when low |
|---|---|---|---|
| Visit to product-page arrival | 30–60% | Traffic intake quality | Landing page mismatched with traffic intent |
| Product page to add to cart | 5–15% | Product persuasiveness | Weak price and review section |
| Add to cart to checkout initiation | 30–50% | Cart propulsion | Shipping shown late, cart chaos |
| Checkout to payment success | 50–70% | Checkout friction | Too many fields, missing payment methods |
| Full chain | 1–4% | Overall result | Determined by each segment's gap |
The ranges are for reference only; the real baseline is your own history: take the fluctuation range of each segment's conversion rate over the last 90 days; below the lower bound of the range is treated as abnormal. Comparing with peers is easily misleading: different categories, order values, and traffic structures mean baselines cannot be directly transplanted.
4. Locating Drop-off: Three-Layer Drill-Down
Layer one: find the gap segment. Compare each segment's conversion rate against its own fluctuation range; the segment with the largest gap exceeding normal water level is the prime suspect. Note that "largest gap" is ranked by drop-off volume (entry volume x drop-off rate), not by drop-off rate: upstream segments have large bases, so a moderate drop-off rate may represent the largest absolute drop-off.
Layer two: segmentation localization. Drill down on the gap segment by dimensions: by channel (which channel's segment conversion collapsed), by new versus returning customers (new customers' checkout drop-off is often several times higher than returning), by device (low mobile payment success rate is a common ailment), by category (some category has high add-to-cart but low purchase, mostly price or inventory issues). After segmentation, you often find that "overall drop-off" is actually a single group's problem, and the fix scope shrinks sharply.
Layer three: behavioral cross-reference. Reconstruct the behavior of the segmented drop-off group: what was the last action before drop-off, where did it error, how long it stayed before leaving. This layer usually needs behavioral detail data (event stream or session replay); it answers what the first two layers cannot: "why". For example, if the high-checkout-drop-off segment is mobile new customers, behavioral cross-reference finds concentration at the address-entry step returning, pointing the direction to the form rather than payment.
5. Three Most Common Pitfalls
Inconsistent windows. Upstream segments attributed by "same day", downstream by "seven days", the funnel mid-section shows absurd results like "conversion rate over 100%". Unify the window and write it into the definition document.
Attribution overlap. A user enters the funnel multiple times in one session (repeated add-to-cart and checkout); counting by event double-counts, depressing the drop-off rate. Deduplicating by session is the conventional solution.
Segments that do not reconcile with the funnel. When segmenting and drilling down, the sum of each subgroup's funnel should approximately equal the overall funnel; failure to reconcile means the segmentation dimension (for example, device attribution) uses inconsistent judgment criteria across steps, making the drill-down conclusion unreliable.
6. From Funnel to Action
The deliverable of funnel analysis is an improvement action list, each item containing four elements: problem localization (which segment, which group), hypothesis (why drop-off), action (what to change), acceptance (expected lift and re-verification time). For example: "checkout-initiation to payment segment, mobile new-customer drop-off abnormal (localization); suspected address form has too many fields (hypothesis); reduce form from 12 fields to 5 fields and support autocomplete (action); expect this group's payment success rate to recover by 5 points, re-verify in 2 weeks (acceptance)."
Baymard Institute's series of e-commerce checkout studies provide a high-frequency list of hypotheses for such scenarios: shipping-fee disclosure timing, forced registration, form length, and payment-method coverage, long occupying the top of abandonment causes: when a funnel gap falls in the checkout segment, checking against this list has a high hit rate. Nielsen Norman Group's methodology for interpreting conversion rates reminds us: the segmentation conclusions from a funnel still need controlled experiments to confirm causality; the funnel localizes "where", the experiment proves "whether the change helps", and the two cannot substitute for each other.
FAQ
Q: How many segments should a funnel be cut into?
A: The standard is "each segment maps to one actionable intervention"; e-commerce 4–6 segments, B2B 3–5 segments is a common range. Too coarse cannot locate the position; too fine makes each segment's sample thin and noisy. Judgment method: try to write for each segment "what should be changed when this segment's conversion is low"; segments you cannot write for should be merged or deleted.
Q: How long should the window period be?
A: Cover one to two typical decision cycles. Low-ASP fast-moving consumer goods can use same-day attribution; high-ASP durable goods seven days or even thirty days. When choosing, look at two data points: the actual interval distribution (median) between adjacent steps of existing users, and the response speed the team's decision needs. The key is consistency throughout: a funnel with inconsistent windows cannot reconcile its segment numbers, and the localization conclusion is unreliable.
Q: What if the funnel segments multiplied do not equal the total conversion rate?
A: First investigate three things: whether the counting unit is mixed (session versus person), whether the attribution window is consistent, and whether each segment's dedup rule is the same (especially in scenarios of multiple funnel entries). Reconciliation is the bottom line of funnel credibility; a funnel that does not reconcile should rather not be used than be taken directly to conclusions.
Q: Drop-off is localized to a segmented group; how to confirm it is causal rather than correlated?
A: Funnel drill-down gives "where drop-off"; confirming causality requires controlled experiments: apply the fix to the drop-off group and split-test against control, observing this group's and the overall metric changes. Reverse verification also works: whether the change's launch timeline matches the drop-off starting point (for example, a regression introduced by a redesign); timeline evidence complements experiments.
Q: Without behavioral detail data, how many layers of funnel analysis can be done?
A: The first two layers (segment gaps, dimension breakdown) can be done with conversion statistics, natively supported by most analytics tools. The third layer's behavioral cross-reference needs event-stream or session-replay data; when absent, proxy signals can substitute: error logs, customer-service inquiry keywords, page-exit-rate distribution. When necessary, add instrumentation at the gap segment: one pass to fill "key action + attribute" is enough; no need for a full instrumentation rebuild.
Q: How often should funnel analysis be done?
A: Routine monitoring checks gaps daily and produces drill-down conclusions weekly; three types of moments require dedicated funnel analysis: when conversion rate fluctuates abnormally, after a major redesign or large campaign launch, and before a seasonal promotion (to set each segment's floor expectation). The difference between routine and dedicated is: routine answers "is there an anomaly", dedicated answers "the root cause and action of the anomaly".
About Tengence
Tengence Search targets the funnel analysis scenarios described in this article, providing conversion statistics for each link in the search and recommendation chain, plus anomaly signals like zero results and query rewriting, supporting drill-down localization of drop-off by channel, segment, and device. Tengence (TENGENCE) is the enterprise growth engine in the AI era, focused on public-traffic acquisition and private-domain conversion; core products are Tengence GEO (dual-engine GEO + SEO) and Tengence Search.
Related Reading
- The Complete Guide to Conversion Rate Optimization (CRO): The Path from Traffic to Orders
- What to Do When E-Commerce Conversion Rate Is Low: Diagnostic Checklist and Walkthrough
- Ecommerce Data Analysis: Core Metrics and Dashboard Design
- How to Make Data-Driven Decisions Work: A 5-Step Enterprise Framework
- E-commerce Site Search Optimization: 5 Steps That Work
Data Sources
- Baymard Institute "Checkout Usability" research topic: a high-frequency list of checkout-segment drop-off causes (shipping-fee disclosure, forced registration, form length), used as a reference when a funnel gap falls in the checkout segment.
- Baymard Institute "Cart Abandonment Rate Statistics": cart abandonment rate baseline and cause composition, used for water-level comparison from add-to-cart to payment.
- Nielsen Norman Group "Conversion Rates: How to Measure and Improve": methodology basis that conversion problems must be interpreted with segmentation and behavior, and causality confirmed by experiments.

